
CONCEPTConcept — not a commissioned project
SOLVENT: a concept cash-flow cockpit and what-if simulator for a small business
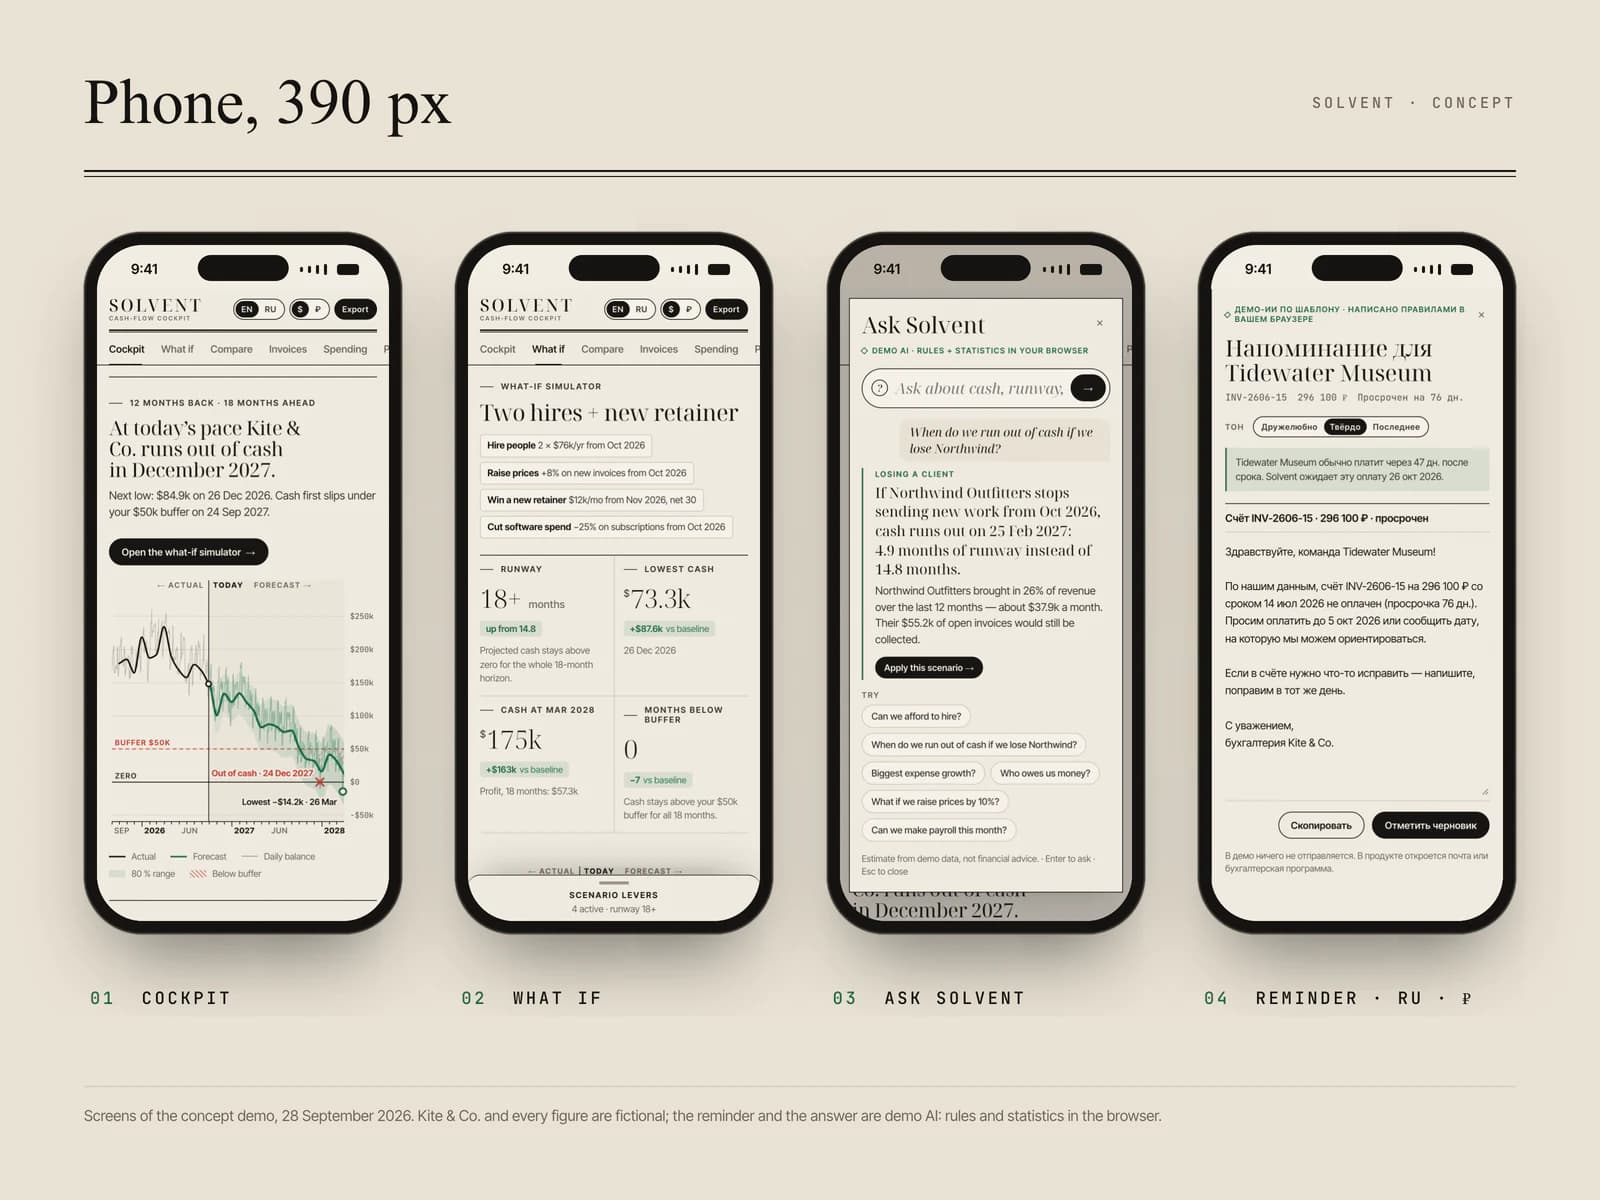
SOLVENT is a cash-flow product VITON13 built as a concept, shown on the books of Kite & Co., a fictional 14-person design-and-print studio. It tells the owner how much cash there is, how many months it will last and what the next 18 months look like, and lets them try a decision before making it: eight levers redraw the forecast at once, and a waterfall shows what each one changes. Everything runs in the browser on generated data, and it is not financial advice.
Open the live project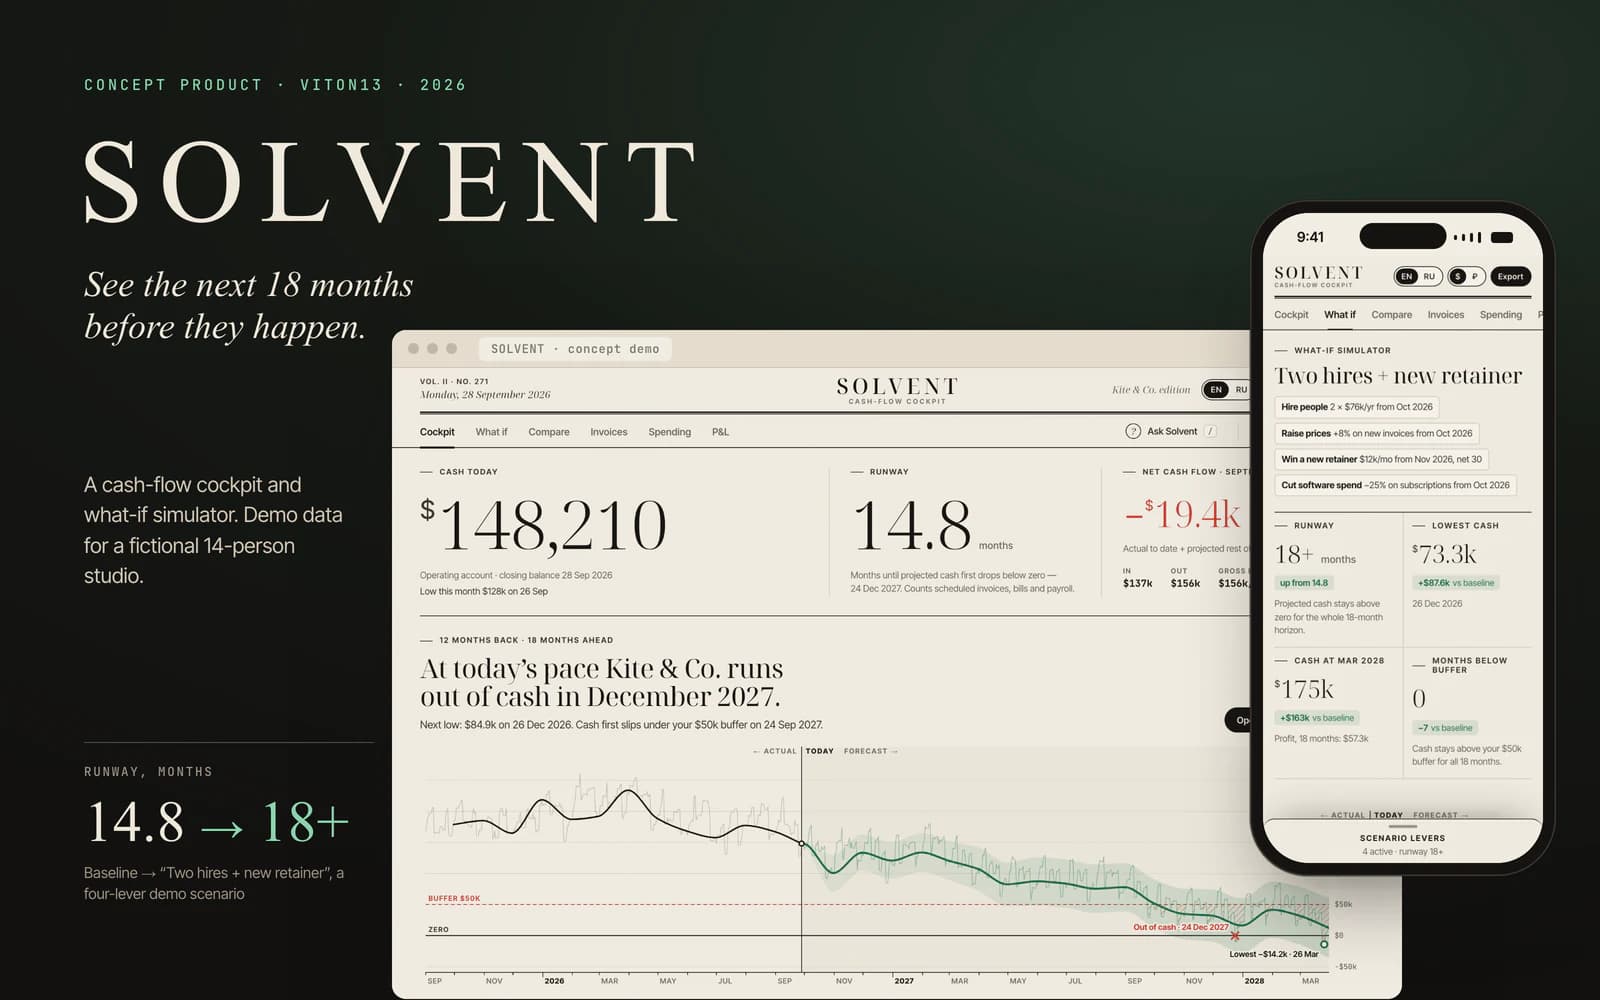
- scenario levers and nine presets; every change recomputes the 18-month forecast
- 8
- automated checks of the maths, all passing: runway, balances, waterfall sums, levers
- 1,927
- all JavaScript gzipped, with no chart, UI or PDF library
- 72 KB
- Lighthouse performance, mobile / desktop, on the live address
- 81 / 98
Task
VITON13 builds concept products to show how it approaches software for a business, not only websites. SOLVENT is the finance tool in that series: a cash-flow cockpit and scenario simulator for owners of small companies, shown on Kite & Co., an invented design-and-print studio with 14 people, ten named clients, fourteen software subscriptions and a lease. The company, its clients, its suppliers and every figure are made up, and the product says so on every screen, along with the fact that it is not financial advice.
The brief we set ourselves had two parts. Answer the three questions an owner asks before payroll (how much cash is there, how long will it last, what happens if we hire, raise prices or lose the biggest client) on one screen, with the definition of every number on the page. And make decisions cheap to try: change something, watch the next 18 months move at once, and see exactly how much of the difference each change is responsible for.
What we did
The cockpit opens on cash today ($148,210, the closing balance of the operating account), runway (14.8 months: the time until the projected end-of-day balance first drops below zero) and this month’s net flow. One chart carries 12 months of actual balance and 18 months of forecast: the daily balance, a month-end curve, an 80 % band taken from the model’s own past error, the cash buffer, the zero line, hatching where cash sits under the buffer, the lowest point and the day the money would run out. Below it are the next 30 days as a strip of money in and out, the largest payments either way, alerts computed from the forecast, the share of revenue each client brings and a short glossary.
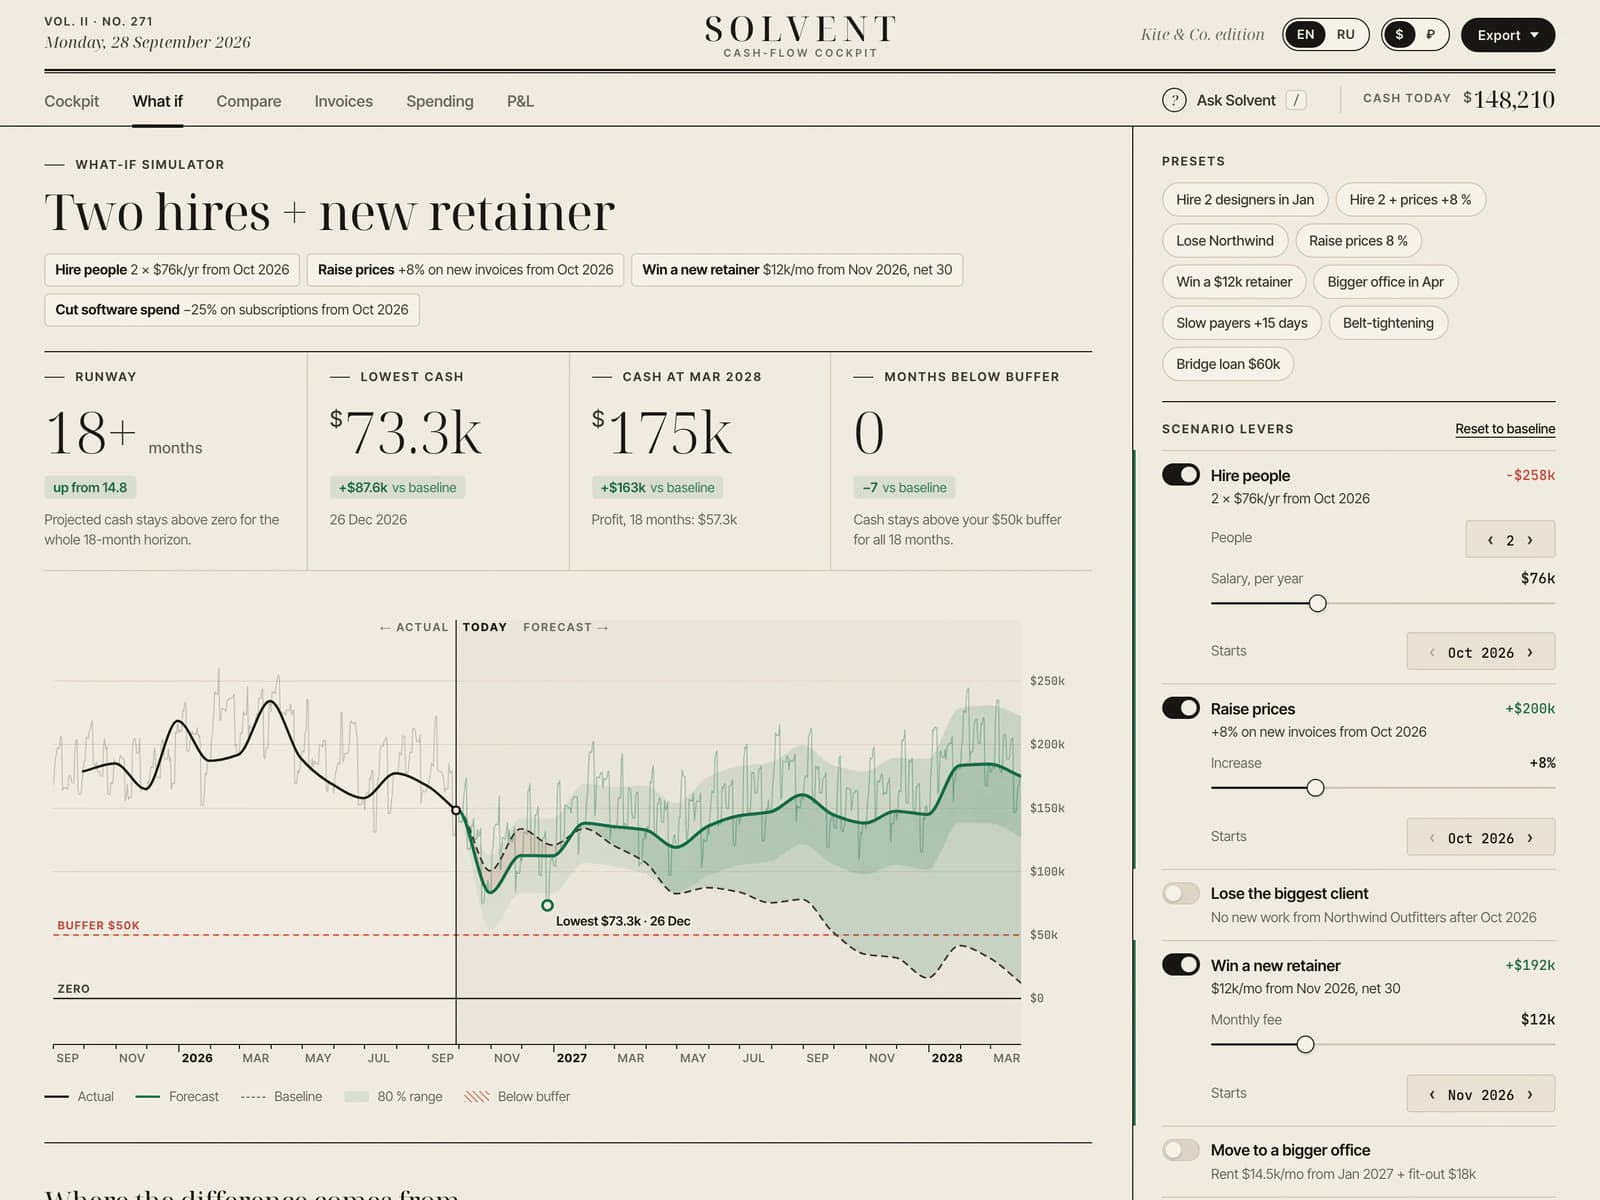
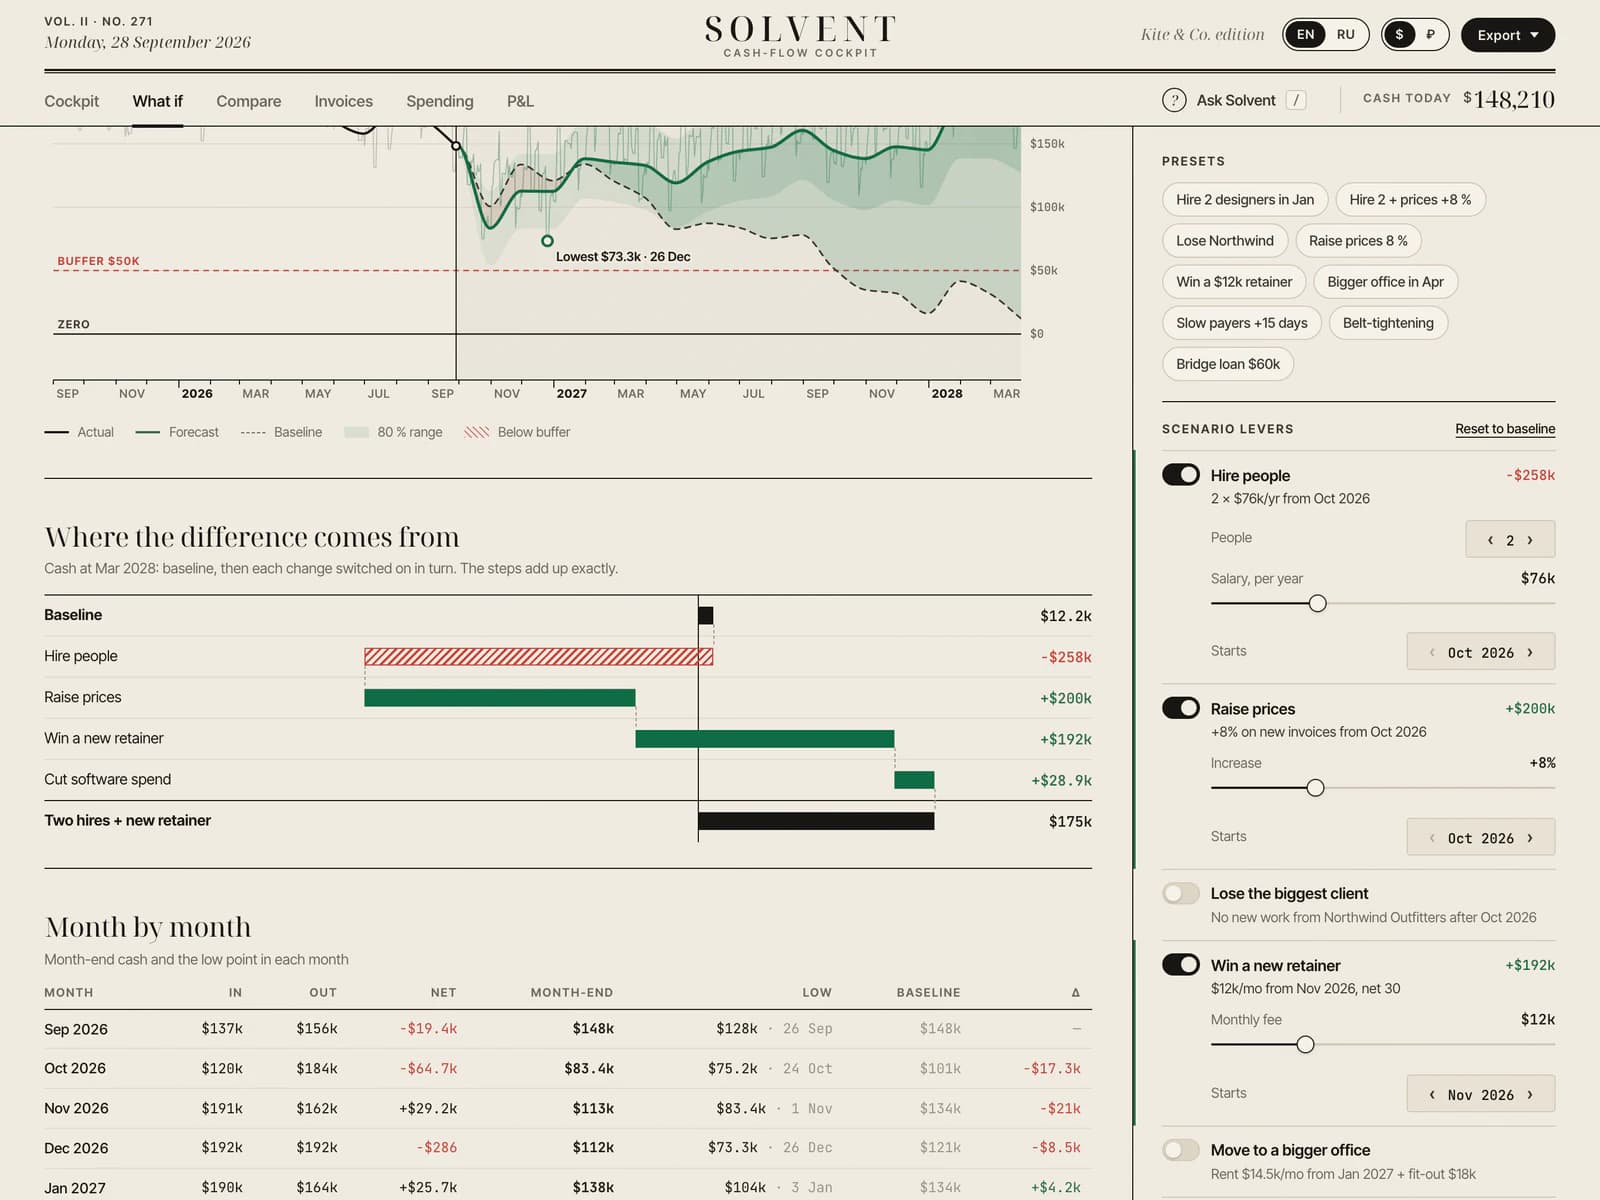
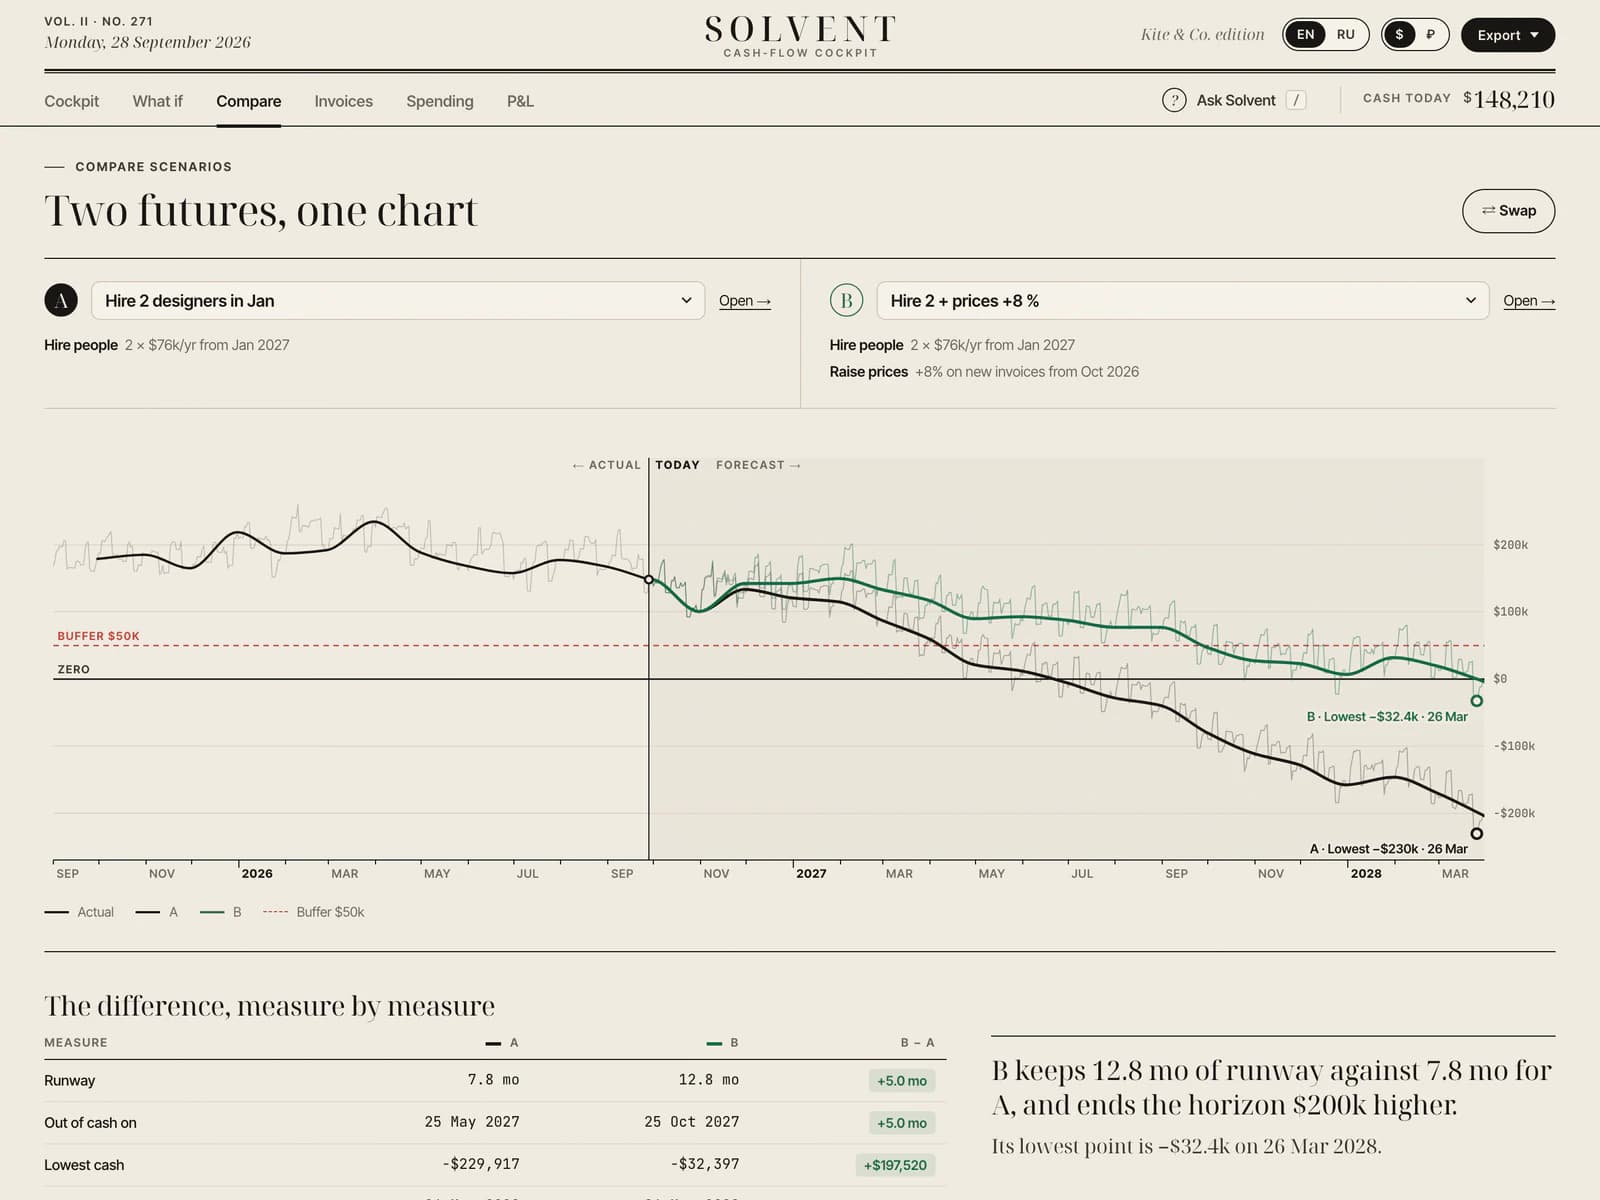
The what-if simulator has eight levers (hire people, raise prices, lose the biggest client, win a new retainer, move to a bigger office, customers pay later, cut software spend or cancel subscriptions, take a loan), each with its own settings and start month, and nine presets. Every change recomputes the forecast at once: the four key figures roll to their new values, the curve morphs while the baseline stays as a dashed ghost, and a waterfall shows what each lever adds to or takes from cash at the end of the horizon. Scenarios can be saved, renamed and reloaded, the buffer is editable, and Compare lays any two scenarios over each other with a table of differences and a one-line verdict. On phones the levers live in a bottom sheet.
Around the simulator sits the rest of a finance tool. Invoices shows receivables in ageing buckets, days to get paid and filters; Chase drafts a reminder from templates, the chosen tone and the client’s own payment habits, and Mark paid moves cash, runway and the 30-day low everywhere, with undo. Spending has a treemap, 12-month trends, anomalies such as software spending up 38 % after three new subscriptions, 90 days of transactions sorted by rules with a confidence score, and subscriptions with a “What if we cancel?” switch that feeds the scenario. P&L gives the monthly statement and a year view. Ask Solvent (/ or ⌘K) answers 15 kinds of question in English and Russian from the same engine, with a one-click “Apply this scenario”. Export writes the scenario as a CSV file and a one-page PDF.
How it works
Kite & Co.’s books are generated deterministically: each calendar month has its own seed, so a month’s ledger never changes when “today” moves, and the balance is anchored at $148,210 on 28 September 2026. Two years of history hold invoices per client with each client’s usual lateness, payroll on the 10th and 25th, rent, subscriptions, freelancers and print costs that follow the volume of work, quarterly tax, seasonality and growth. The forecast is built from the same drivers without the noise: open invoices arrive on the client’s usual payment date, and each lever edits dated events. Levers are attributed one after another, which is why the waterfall adds up exactly to the scenario minus the baseline. The project’s own test suite checks that sum, the runway definition, the balance roll-forwards, every lever’s identity, determinism and the assistant’s answers: 1,927 checks in all.
The app is plain JavaScript modules bundled with esbuild into a static folder with relative URLs; on the portfolio it lives at /demos/solvent/. The charts are our own SVG, the CSV export is our own (UTF-8 with a byte-order mark, and semicolons with decimal commas in Russian, so a spreadsheet opens it cleanly), and the PDF is drawn on a canvas and wrapped by a minimal PDF 1.4 writer we wrote: there is no chart, UI or PDF library. The design is a financial newspaper on warm paper, with Noto Serif Display for headlines, Inter Tight for text and JetBrains Mono for figures, all self-hosted, and a night edition. The interface is in English and Russian, shows dollars or roubles at a fixed demo rate of 90 to the dollar, opens with an intro of up to three seconds that can be skipped, and calms its motion for visitors who ask for reduced motion.
What exists now
What exists now is a working concept at tarasovvitalii.com/demos/solvent/ with six sections (cockpit, what if, compare, invoices, spending and P&L) plus Ask Solvent and the exports, built on 28 September 2026. That day its test suite passed all 1,927 checks. In headless Chrome we opened every section in English at 1440 px and in Russian on a 390 px phone, applied a preset, marked an invoice paid (cash in the header moved from $148,210 to $151,500), asked a question and downloaded the CSV and the PDF, under the portfolio’s production content security policy: no console error, no policy violation, no sideways scroll and no request to any other server.
All the JavaScript is 11 files and 220 KB, or 72 KB gzipped; the whole folder with its fonts is 0.65 MB. On the live address, Lighthouse 13.5 (five runs per device, medians, on a MacBook with a load average of 3–9) gave performance 81 on mobile and 98 on desktop, with accessibility and best practices at 100 on both, and the page transfers 0.47 MB on load. Before measuring we fixed three things in the app: a footer that jumped on load, a chart and a button without an accessible name, and toggles under 24 px on phones.
What this does not prove
SOLVENT is a concept VITON13 built to show range, not a commissioned product. Kite & Co., its clients, suppliers, staff and every figure are fictional and generated in the browser: there is no client, no users, no bank connection, no traffic and no revenue, and nothing in the demo is for sale. It is not financial advice: the forecast is a simple model that assumes flat demand beyond seasonality and no clients lost when prices rise, and its 80 % band describes the model’s own error on invented data.
Ask Solvent and the reminder drafts are demo AI: rules and statistics in the browser, not a language model, and no reminder is ever sent. The 1,927 checks prove that the maths agrees with its own definitions, not that the forecast would be right for a real business. Every figure is a lab measurement in headless Chrome on one machine on one day, and Lighthouse ran on the live address with a simulated phone, not on real devices. A production version would still need bank feeds, an accounting integration, accounts and roles, encrypted storage and a review by finance professionals.
SEO review
Measured on the live address on 28 September 2026. Lighthouse (five runs per device, medians, on a MacBook with a load average of 3–9) gave performance 81 on mobile (LCP 3.5 s, 0.47 MB) and 98 on desktop (LCP 0.81 s), with accessibility and best practices at 100 on both. SEO is 63 because the demo is marked noindex, nofollow in the page and in the server header: it is a concept, and the page meant for search is its case on the portfolio.
Checked on 28 September 2026: 6 pages rendered in Chrome the way a search crawler sees them, plus Lighthouse 13 on the home page.
Lighthouse, home page
- Performance
- Mobile81Desktop98
- Accessibility
- Mobile100Desktop100
- Best practices
- Mobile100Desktop100
- SEO
- Mobile63Desktop63
On-page and technical checks
- Unique page titlesmissing1/6
- Title length 30–65 charactersmissing0/6
- Meta descriptions 70–170 charactersmissing0/6
- One H1 per pagein place6/6
- Page language declaredin placeen
- Mobile layout without sideways scrollin place390 px
- Images with alt textin place0 img
- Broken internal linksin place0
- Canonical URLmissing0/6
- Open Graph title and imagemissing0/6
- Structured data (JSON-LD)missing0/6
- sitemap.xml and robots.txtpartly1/2
Checked on the 6 views of the one address, rendered in headless Chrome at 390 px and 1440 px. In place: exactly one H1 on every view, the language declared (en, and ru after the switch), no sideways scroll at 390 px and 0 broken links among the targets (the six views, studio.viton13.com and the portfolio case); there is no <img> to describe, because the charts are SVG, and the main chart carries an accessible name. Missing: all 6 views share one title of 68 characters and one description of 215, and there is no canonical URL, no Open Graph image (only a title and a description) and no JSON-LD. robots.txt sits at the domain root; the demo is kept out of sitemap.xml on purpose.
If SOLVENT were a real product: keep the app itself behind a login and out of search, and give it a public site instead, with a page per feature (cockpit, scenarios, receivables, spending), each with its own title of 30–65 characters, a description of 70–170, a canonical URL and an Open Graph image; add JSON-LD (Organization, SoftwareApplication, FAQPage for the definitions, BreadcrumbList) and list those pages in sitemap.xml. On the live address the mobile score is held back by the largest paint, the cockpit headline, which appears only after the intro (LCP 3.5 s); a shorter intro would lift it.
Services this case shows
Describe the task on the service page; a written scope, timeline and price come back within one working day.
Discuss a similar projectMore cases
All cases
CONCEPTConcept — not a commissioned project
Möbius School & Institute
Concept site · three.js · English, Russian · 2026
Möbius is a fictional school and institute for ages 5 to 25, and this is the site VITON13 built for it as a concept for schools, colleges and universities. On the home page 40 story cards ride a real Möbius band in three.js; behind it are a “Who we are” film, programmes, admissions tools, a campus map and My Möbius, a working demo of the personal account for students, parents and teachers.
Read the case →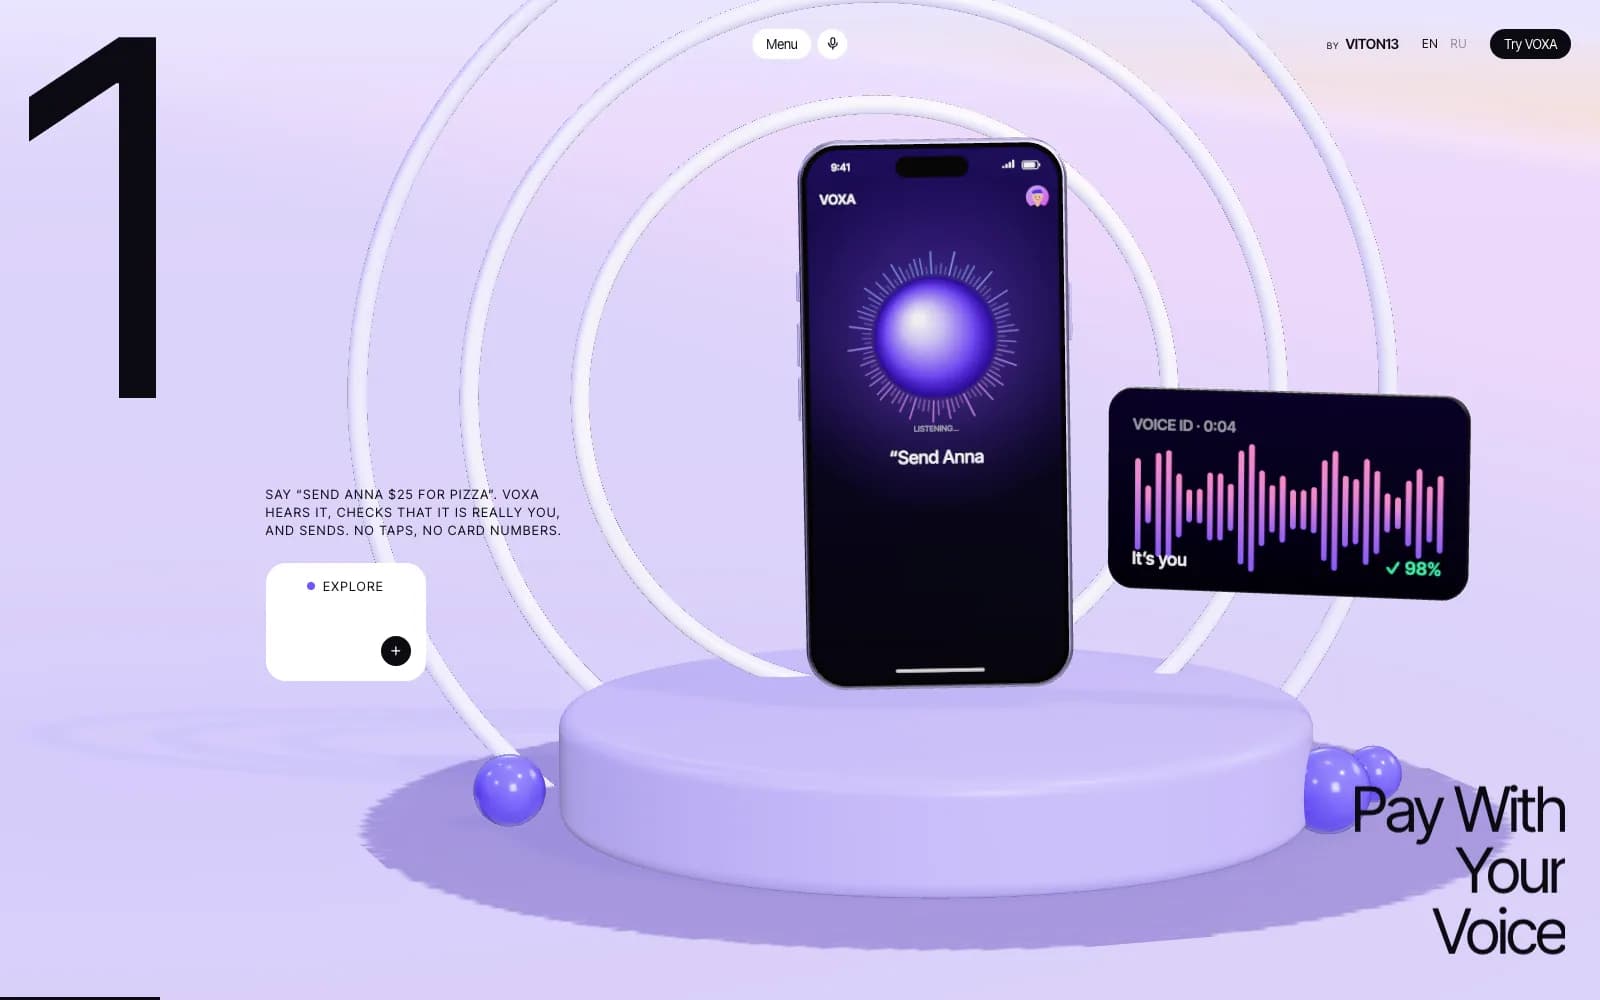
CONCEPTConcept — not a commissioned project
VOXA — Bank of the Future
Concept site · three.js · voice · English, Russian · 2026
VOXA is a fictional bank of the future, and this is the site VITON13 built for it as a concept for banks and fintech products. A camera flies through one three.js world with ten features; each opens a working phone app where a visitor pays a friend by voice, saves for a shared dream, buys a flight that turns into a boarding pass or designs a card, and a closing scene with two Veo 3.1 films hands the microphone to the visitor.
Read the case →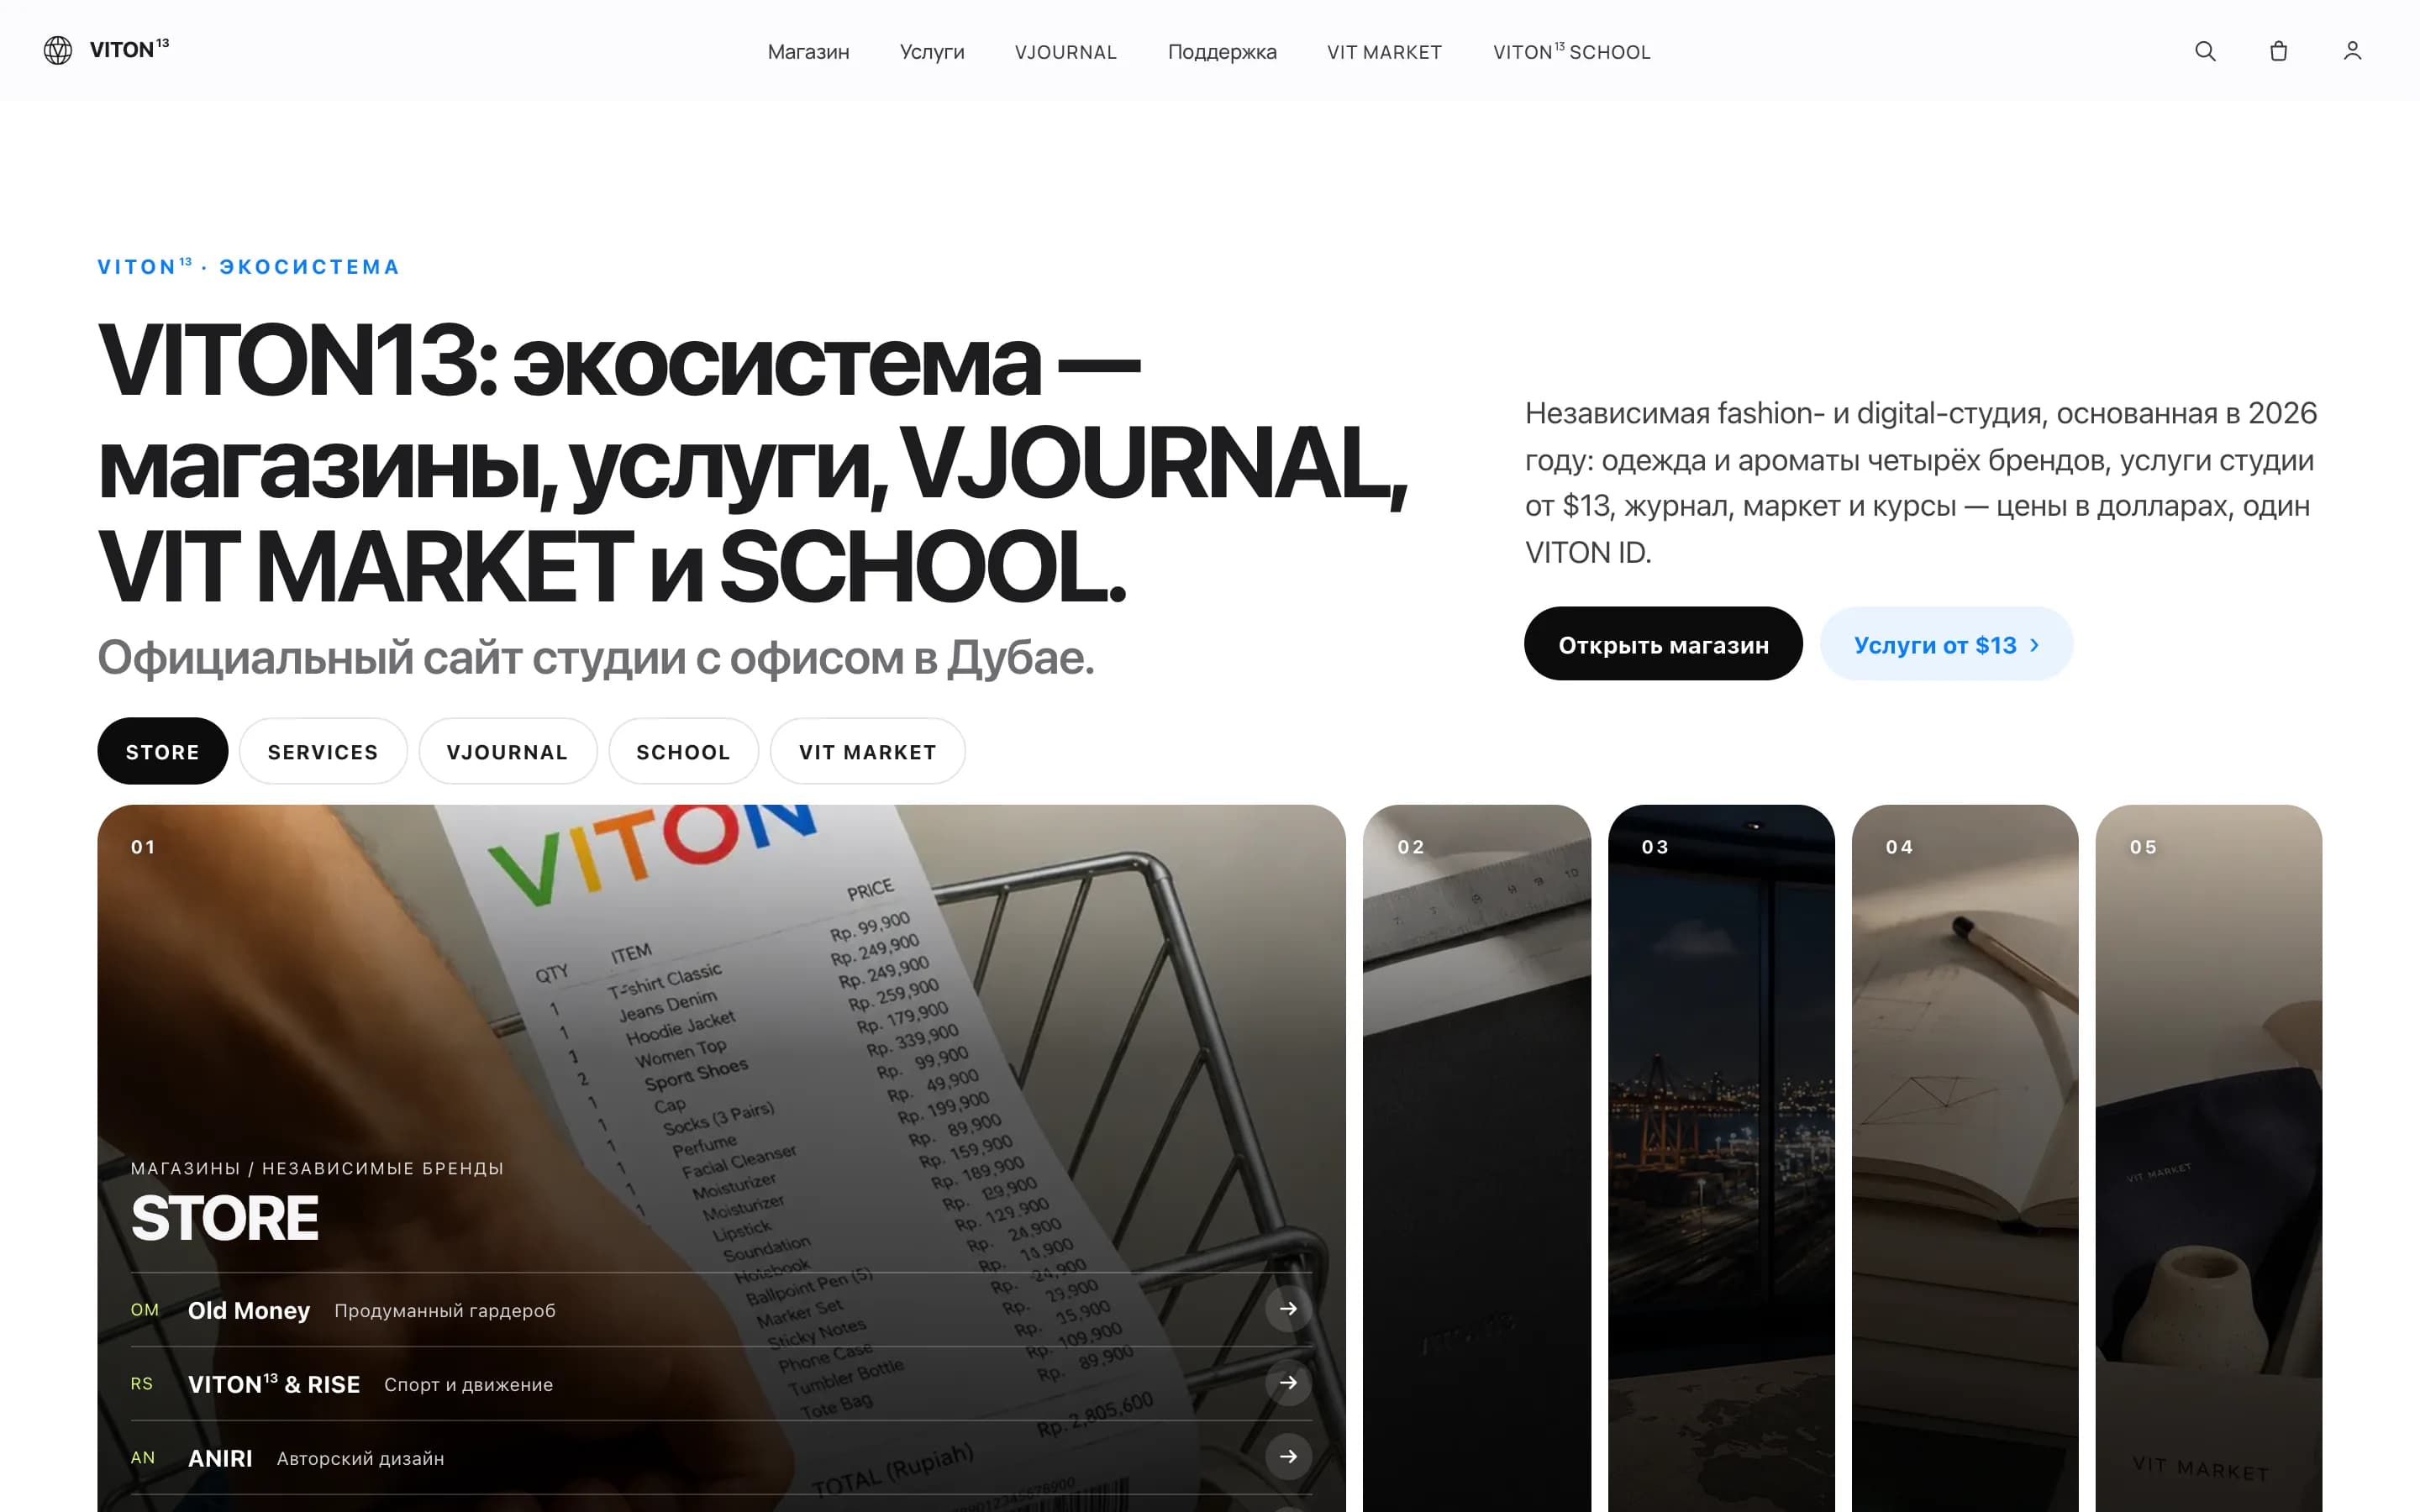
INTERNALOur own product
viton13.com
Next.js 16 · 5 languages · 7 hosts · 2026
VITON13’s own website: one Next.js application serves the main domain and six section subdomains in English, Russian, Spanish, French and Hindi. Before a release goes live, a crawl checks its internal routes.
Read the case →